

⚠️ This Is Not Investment Advice
Educational Market Framework for 11-20-25
The goal of this breakdown is to give you a clean, structured, repeatable way to analyze a potential SPY trade setup—without telling anyone what to buy or sell.
This is market research and volatility analysis only.
Today’s environment sits right at the intersection of elevated volatility, macro uncertainty, and a long-delayed Tier-1 economic release. Here is the full context for anyone studying short-term options structures.
📌 Market & Event Context
The delayed September jobs report finally dropped:
+119,000 jobs added (well above expectations)
August revised to a small loss
Unemployment rate: 4.4%
Government shutdown delays mean the BLS will not publish October’s household survey
Cross-asset volatility is elevated, SPY implied volatility remains high, and we classify this as a High Event-Risk environment.
This is typically when markets reprice very quickly.
One important additional note for today’s market context is the impact of Nvidia’s earnings. Several major outlets reported that Nvidia’s strong results and bullish forward guidance were the primary catalysts behind the early rally in U.S. equity futures, with the stock jumping more than 5% overnight. Because Nvidia is considered the bellwether of the AI build-out, its surprise upside move significantly boosted sentiment in the tech sector and contributed to the broader market’s early strength. This surge helped lift SPY futures before the opening bell, adding an additional layer to the volatility landscape beyond the jobs data and macro uncertainty. While the labor numbers created a high-risk environment, Nvidia’s earnings acted as a counterweight, temporarily stabilizing risk appetite and supporting the morning move higher.
📌 Regime & Trend Overview
Labor data is mixed. Jobs came in stronger than expected, but unemployment rose. That pushes the market into a choppy, mean-reversion-prone regime.
Additional signals:
Realized volatility: ~13–15%
Implied volatility: ~19–20%
When IV is this much higher than realized vol, it tells us the market expects larger moves than what has actually occurred.
ATR readings (1-day, 9-day, 14-day) are likely rising into today’s event window, signaling expanding price range potential.
📌 Volatility Edge (Educational Only)
30-day IV: ~19.67%
30-day HV: ~14.7%
IV Percentile: ~86%
That percentile alone tells the story:
Options are rich right now.
ATM IV has been slightly compressing, but it still sits at elevated levels due to macro uncertainty. This is one reason traders study short-vol structures during events—but high IV also means high risk if the market makes a directional surprise.
📌 Skew & Smile
Current readings show:
Put/Call IV ratio: ~0.92
→ Calls priced slightly higher than puts
→ Mild bullish skewWings appear overpriced relative to baseline diffusion models (typical before Tier-1 events)
The volatility smile is elevated and slightly convex, which is normal ahead of meaningful economic releases.
📌 Probabilistic Analysis (1-Day Window)
Using IV ≈ 19.7%,
you get approximate expected moves:
1σ: ~$2
2σ: ~$4
3σ: ~$6
Tail-event probability (3σ+) is roughly 0.5–1% given today’s macro backdrop.
Markov regime models suggest an elevated chance of a volatility regime transition—exactly what you’d expect when event-driven pricing dominates the tape.
Expected shortfall in an extreme downside move: $8–$10.
📌 Flow & Sentiment
Options flow heavy
IV Rank high (hedging or aggressive premium activity)
VIX elevated
Tech/AI correlation remains strong, and AI layoffs appear to be impacting market sentiment
This is not a stable backdrop.
It’s a reactive one.
📌 Systemic Correlation
SPY continues to move closely with mega-cap tech, AI-exposed names, and broad indexes.
Macroeconomic data and AI-driven labor trends feed directly into S&P 500 sensitivity.
Today’s environment is a blend of:
Labor data distortion
Shutdown-based reporting gaps
Elevated implied volatility
Rising unemployment
Stronger-than-expected job growth
Perfect recipe for a jumpy tape.
📌 Strike & Structure Framework (Educational Only)
This is NOT investment advice. This is simply what traders look at when evaluating potential setups.
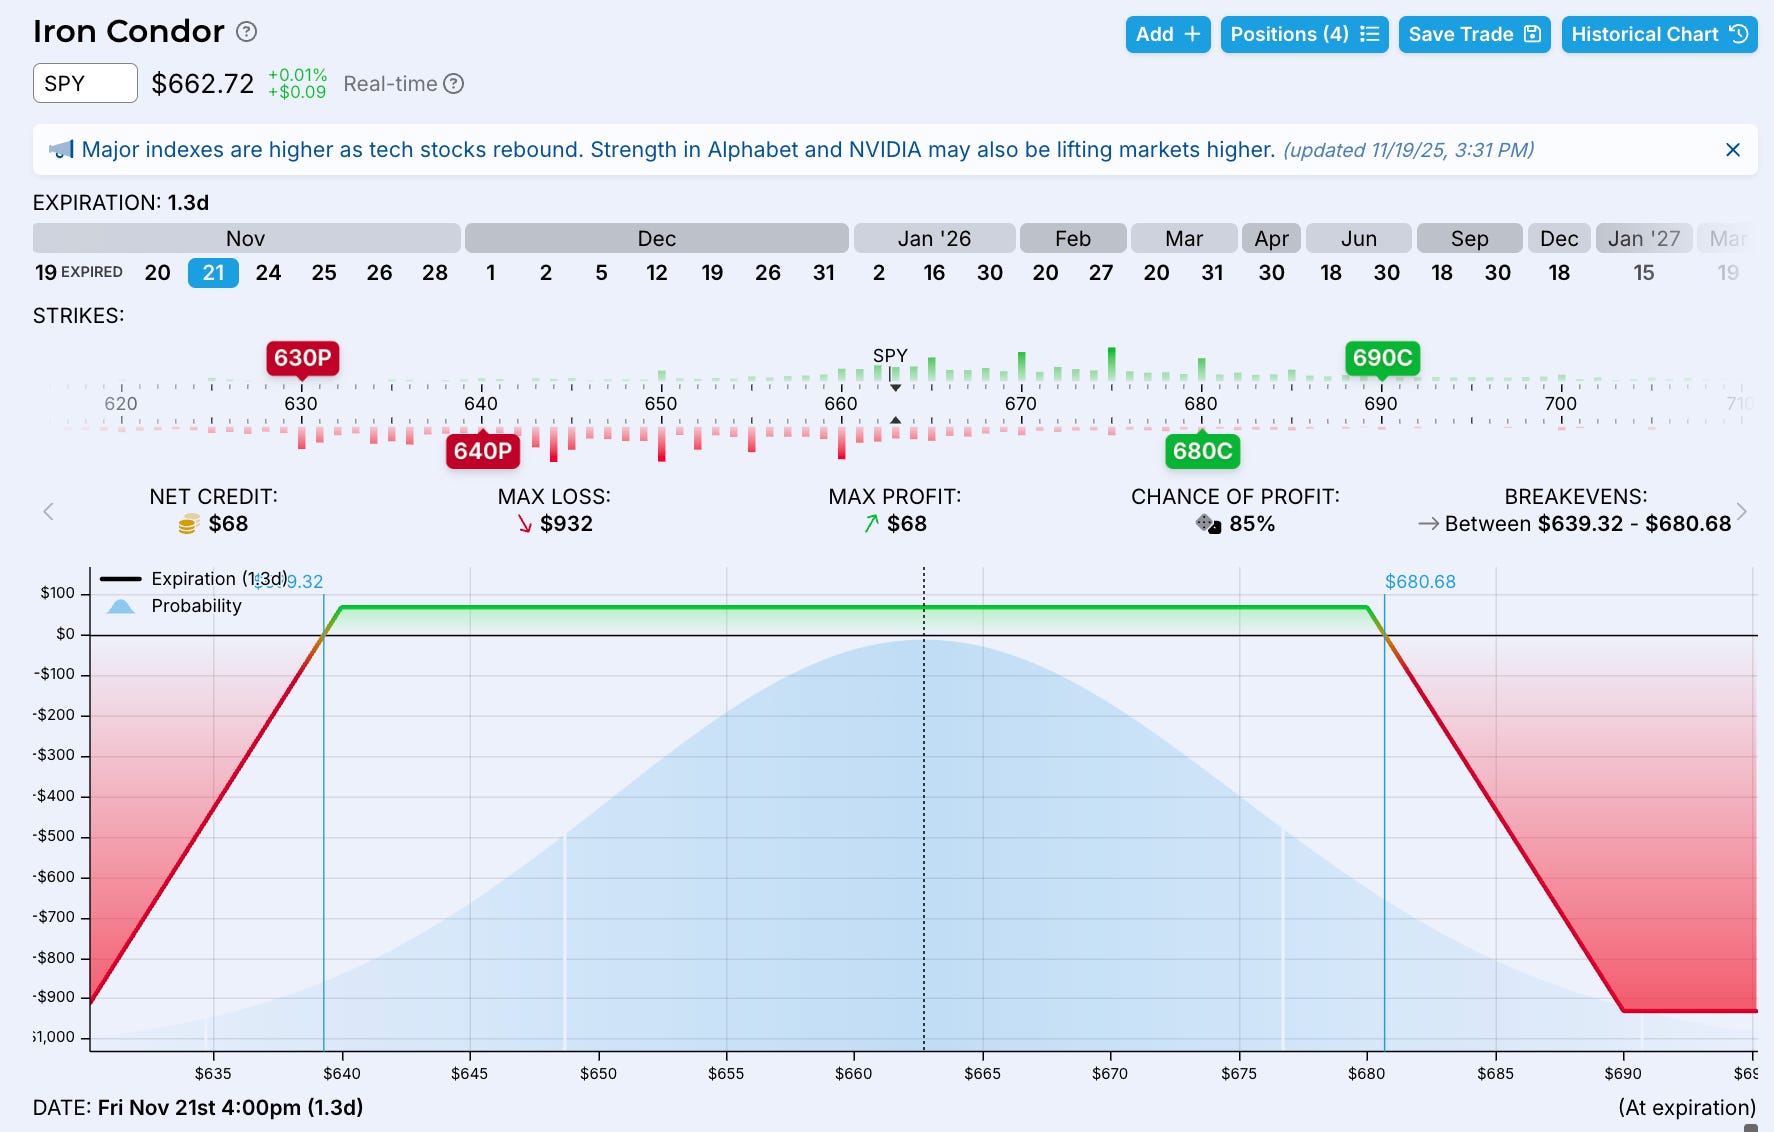
With DTE = 1, high IV, and a Tier-1 release, traders typically analyze defined-risk structures such as:
Iron Condors
Vertical credit spreads
Iron Butterflies
A 10–15 delta wing approach is a common analytical framework.
Example only — NOT advice:
If SPY is around $662
10Δ call ≈ $680
10Δ put ≈ $640
Defined-risk wings might be set ±10 points
Greeks tend to be:
Short gamma
Positive theta
Short vega
Delta-neutral if symmetric
Break-evens would sit near the short strike ± credit collected (example only).
This is the evaluation process, not a recommendation.
📌 POP / EV Table (For Study Only)
MetricNotesProbability of Profit~60–70% depending on width & IVEV ExampleCredit minus (Probability of loss × loss size)Tail RiskElevatedVol CrushPossible post-event
The main point:
Short-term defined-risk trades must be evaluated carefully because EV can be negative if credit is too small.
📌 Execution Framework (Educational Checklist)
This is simply what many traders study during volatile, event-driven windows:
Before the event:
Use defined risk
Reduce size
Widen wings
Focus on credit:width ratio
Keep orders to limit only
Risk management considerations:
Re-evaluate if price breaches a short strike
Re-evaluate if delta > 0.50
Time-stop before end of day
Consider early exit on vol crush
Profit-taking frameworks traders look at:
35% of credit
55%
70%
Optional hedge: small OTM put to cap tail risk (cost reduces credit).
Final Grade & Summary
Grade: B-
Not because the trade is good or bad—but because the environment contains both opportunity and instability.
Rich options
High event risk
Very short DTE
Uncertain labor data
Expanding ATR
Elevated IV percentile
It’s a fascinating setup to study.
And a risky environment to trade without experience.
⚠️ Final Disclaimer
This entire post is educational market commentary and volatility research only.
Nothing here is investment advice.
Nothing here is a suggestion to buy or sell any financial instrument.